Reporting
Understand what you are earning 24 hours a day 7 days a week.Simple, cool environment.
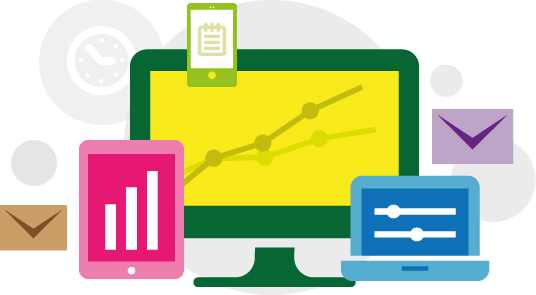
We believe that clear, accurate and real time analytics, available 24 hours a day, is vital for affiliate performance. We have built our Quinternet reporting portal to be a clean and simple environment, which can be viewed on desktop PC, tablet and phone.
Affiliates now have two ways to view their results. The Quinternet overview dashboard allows affiliates to analyse their performance across all campaigns, products, and sub-affiliates, as well as easily identifying best performers in the Quinternet Top 5’s tables.
Our reporting software also breaks down each campaign, day-by-day and by sub-affiliate. This allows you to accurately pinpoint peaks and dips in performance. A valuable tool for improving future campaigns.
Our detailed management dashboard makes it incredibly easy to edit anything from personal to specific campaign information.
Serious about your profits?
SIGN UP NOW
Myloan moved to being
our top performer inside
one week. Single
lenders just can't
compete with a
Myloan. 
-
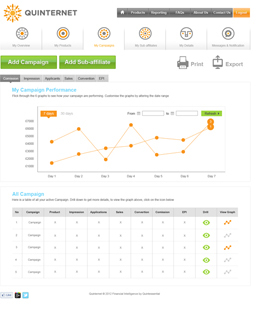
Campaign Breakdown
In campaign breakdown, affiliates can manually select campaigns to compare in the graph for: Commission, Impressions, Applicants, Sales, Conversion and EPI. The graph has the option to measure performance across 7 days, 30 days or a specific date range.
All campaigns are listed in table form for the same performance indicators. Affiliates can drill down to view either a day-by-day or sub-affiliate breakdown of performance for each campaign, over 7 or 30 days. All our reporting is easily downloaded to PDF or available to print.
-
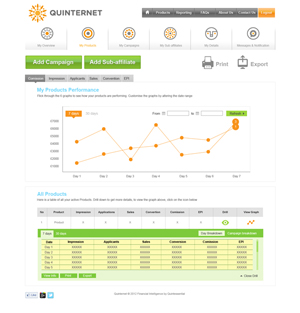
Product Breakdown
In campaign breakdown, affiliates can manually select campaigns to compare in the graph for: Commission, Impressions, Applicants, Sales, Conversion and EPI. The graph has the option to measure performance across 7 days, 30 days or a specific date range.
All campaigns are listed in table form for the same performance indicators. Affiliates can drill down to view either a day-by-day or sub-affiliate breakdown of performance for each campaign, over 7 or 30 days. All our reporting is easily downloaded to PDF or available to print.
-
Sub-Affiliate Breakdown
For larger affiliates who manage a number of sub-affiliates within their network, our software allows detailed reporting on their performance.
The sub-affiliates are listed in table form with the ability to drill down to view day-by-day performance, as well as campaign breakdown for each specific sub-affiliate. Performance indicators include: Commission, Impressions, Applicants, Sales, Conversion and EPI’s.
To compare sub-affiliates directly, each one can be individually selected to view in graph form. A great visual method for comparing performance. The graph measures performance over 7 days, 30 days or a specific date range. All reporting is available to print and to download.
Quinternet © 2024 Financial Intelligence by Quintessential
Quint Group Ltd is registered in England and Wales (Company number 6898873). Registered Office; Oxford House, Oxford Road, Macclesfield, Cheshire SK11 8HS
Quint Group Ltd is Authorised and Regulated by the Financial Conduct Authority and is entered on the Financial Services Register under number 669450
Registered with the Information Commissioners Office (registration number Z2238052)